Plans: Ranking Sports
First, we will use a bar chart where the x-axis will be the different sports and the y-axis the corresponding number of athletes. See Figure 19.
Second, we will show this ranking using a word cloud in which larger font size denotes a higher number of participants. This graph will be clearer and more direct because viewers can intuitively get a sense of the relative size of participation of a sport. See Figure 20.
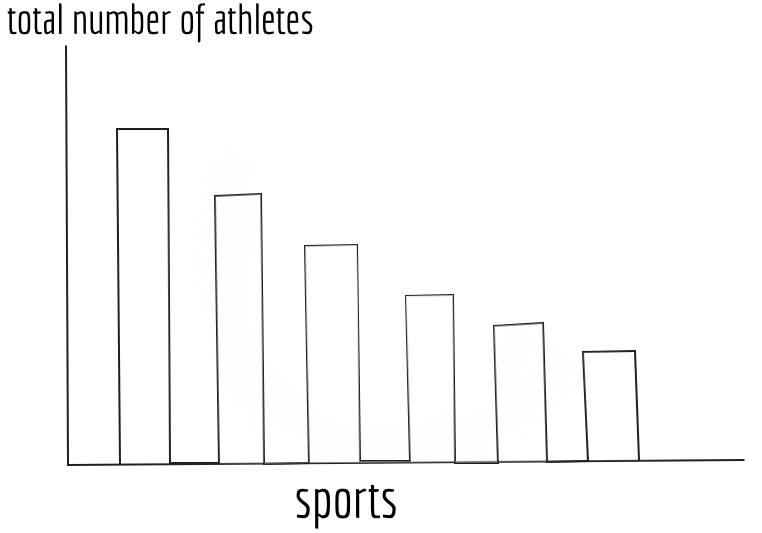
Figure 19: Bar chart for sports ranking
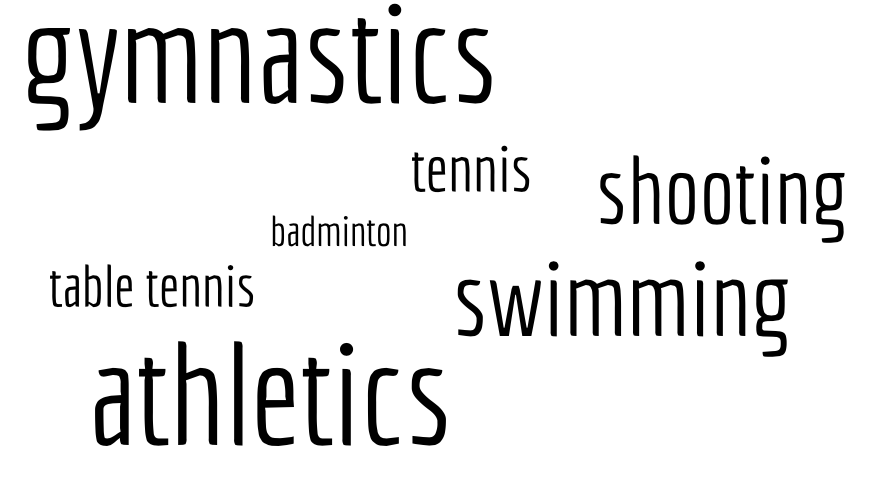
Figure 20: Word cloud for sports ranking